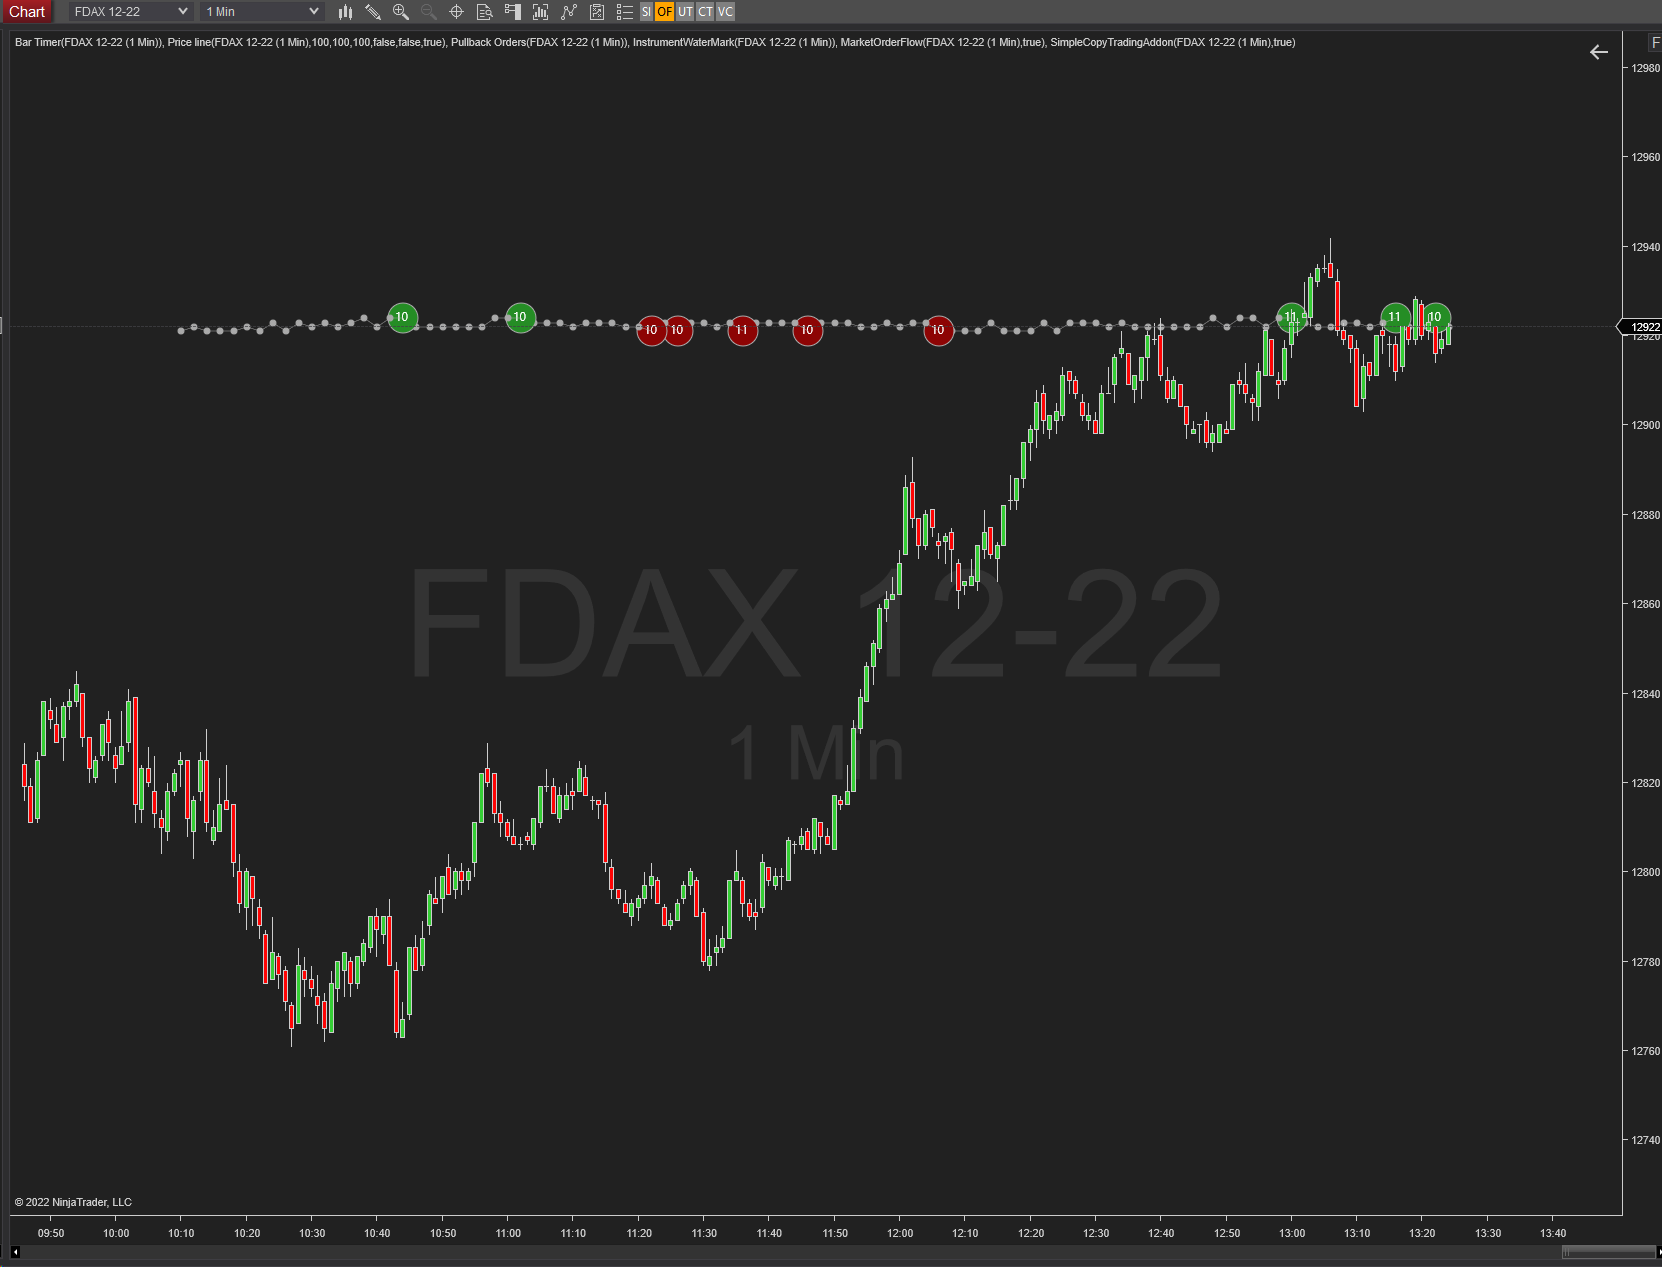
Market Orderflow Indicator
DISCOVER THE HEARTBEAT OF THE MARKET IN YOUR CHART

Why is it important to watch the market order?
Many market participants enter or exit the market at support and resistance zones. The dynamics that arise at these zones can be seen in an order book, in a footprint or in our market order flow indicator.
Confirmation
It can be crucial for the day trader to get confirmation from the current market orders at the important zones.
Trading Flow
You are in your trading and need a feeling for the current state of the market. Then this indicator helps you to see the market a little better.
Imagine you are standing directly at the counter and see what is going on.
Motivation/Background
… In daily routine to the chart we wanted to have a view of the current situation in the market. When come active buyers and sellers. How many contracts are now going around and are moved.
Especially at crucial price zones, you can then see the dynamics with which the market participants approach the zone.
Properties
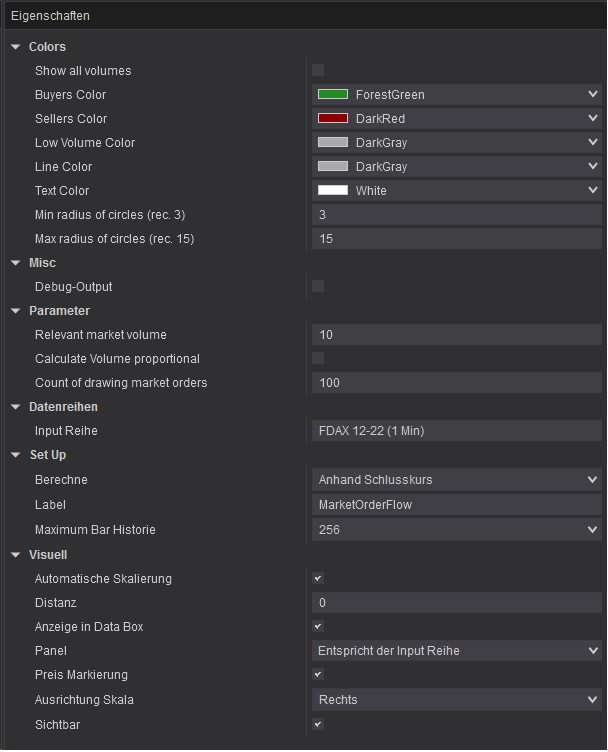
Full flexibility over your individual configuration.
You can define your threshold for :
– min count of contracts at the same time for buyers or sellers that you will see
– max count of contracts for last the time
– color of buyer, sellers, lines and volumen which does not interest you

See and fell the heartbeat of the market in your chart


