
Beschreibung
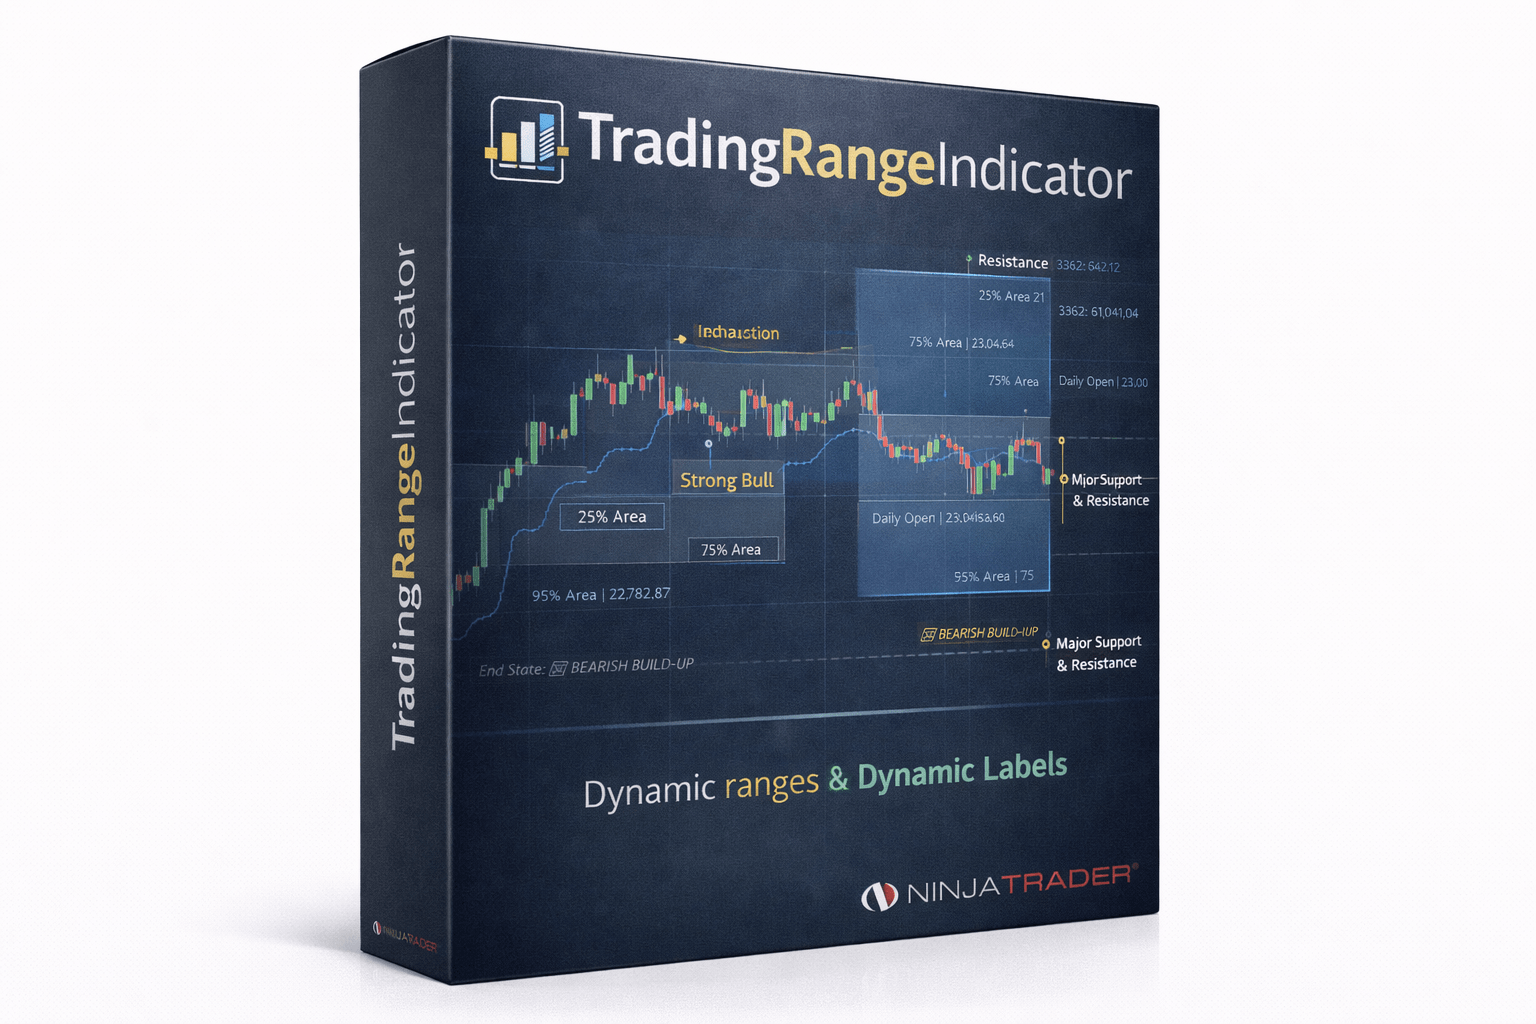
The Professional Blueprint for Daily Price Action
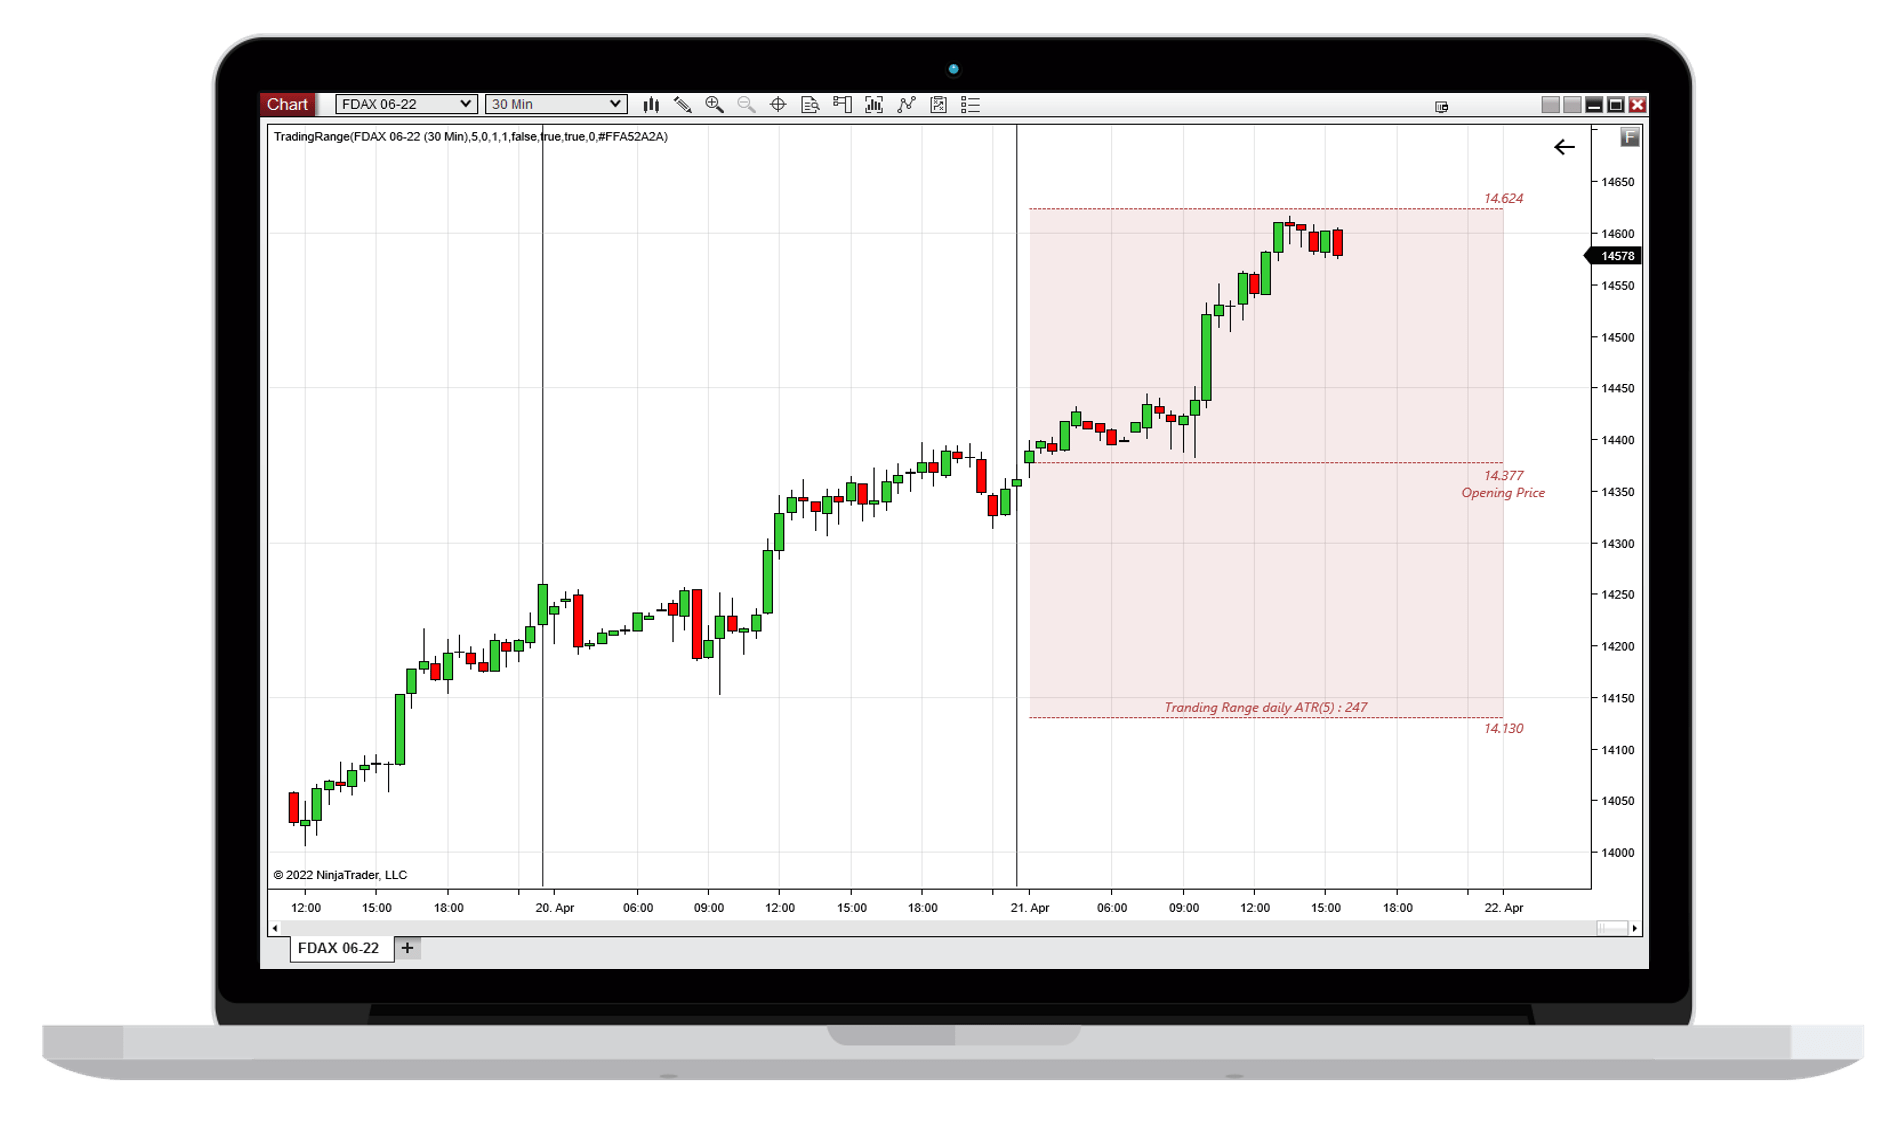
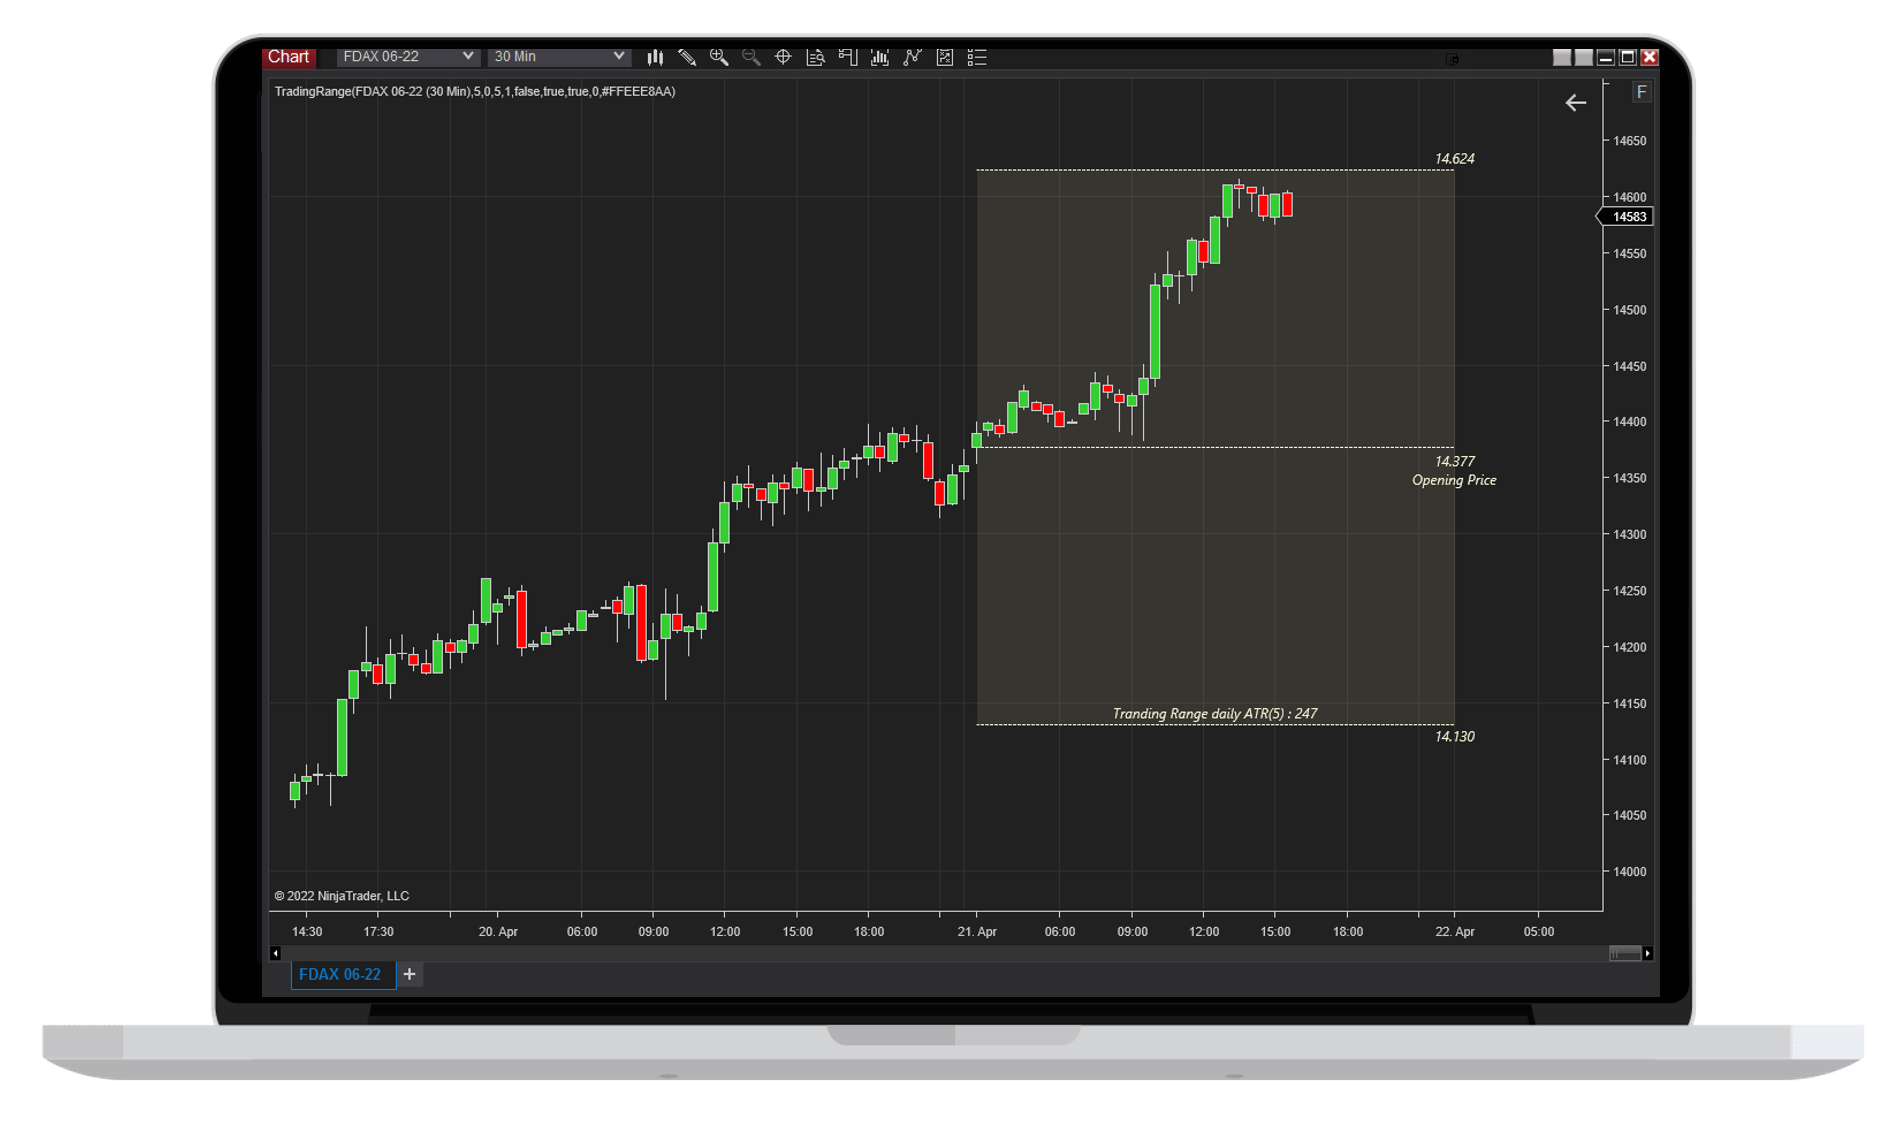
Successful trading is about knowing when a market is „cheap“ and when it is „expensive.“ The Trading Range Indicator uses mathematical volatility (ATR) to redefine these zones daily. It projects the expected trading range directly onto your chart, including critical quartile zones for mean-reversion or breakout setups.
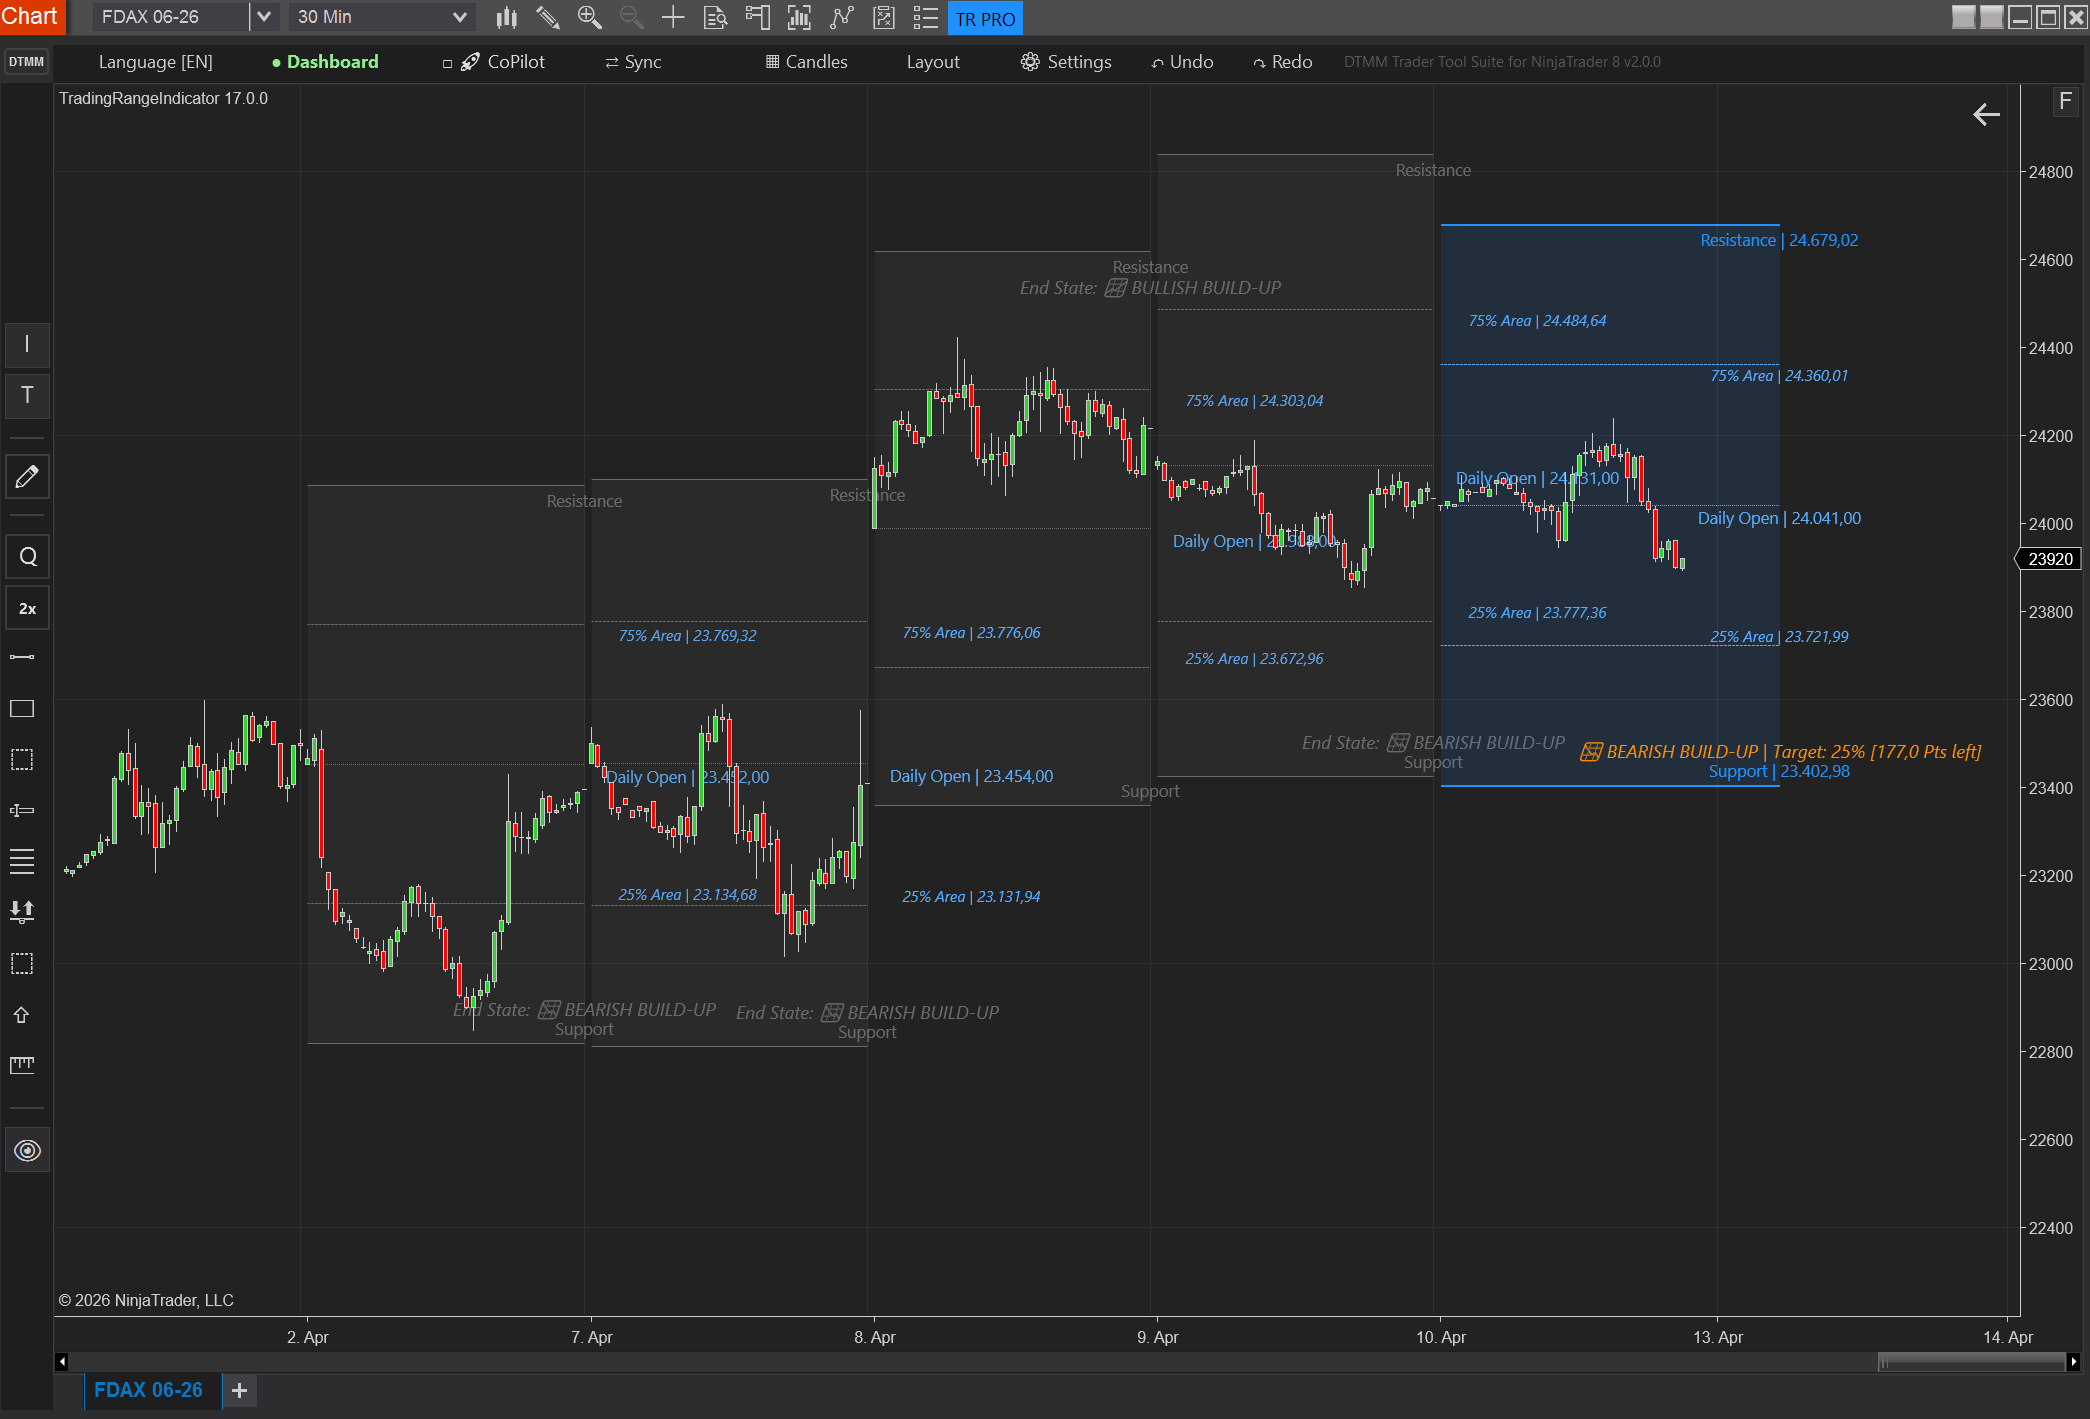
1. Intelligent Market-State Labeling
The heart of the TR PRO is the dynamic strategy tracker. It analyzes price position within the range and provides clear situational feedback:
- ✓ Strong Bull / Bear: Detects strong trend phases and calculates the remaining distance to the target.
- ✓ Exhaustion: Warns you of overextensions at the ATR limits (Oversold/Overbought).
- ✓ Build-up Phases: Indicates when the market is prepping for the next move within the Value Area.
2. Precision Volatility Zones
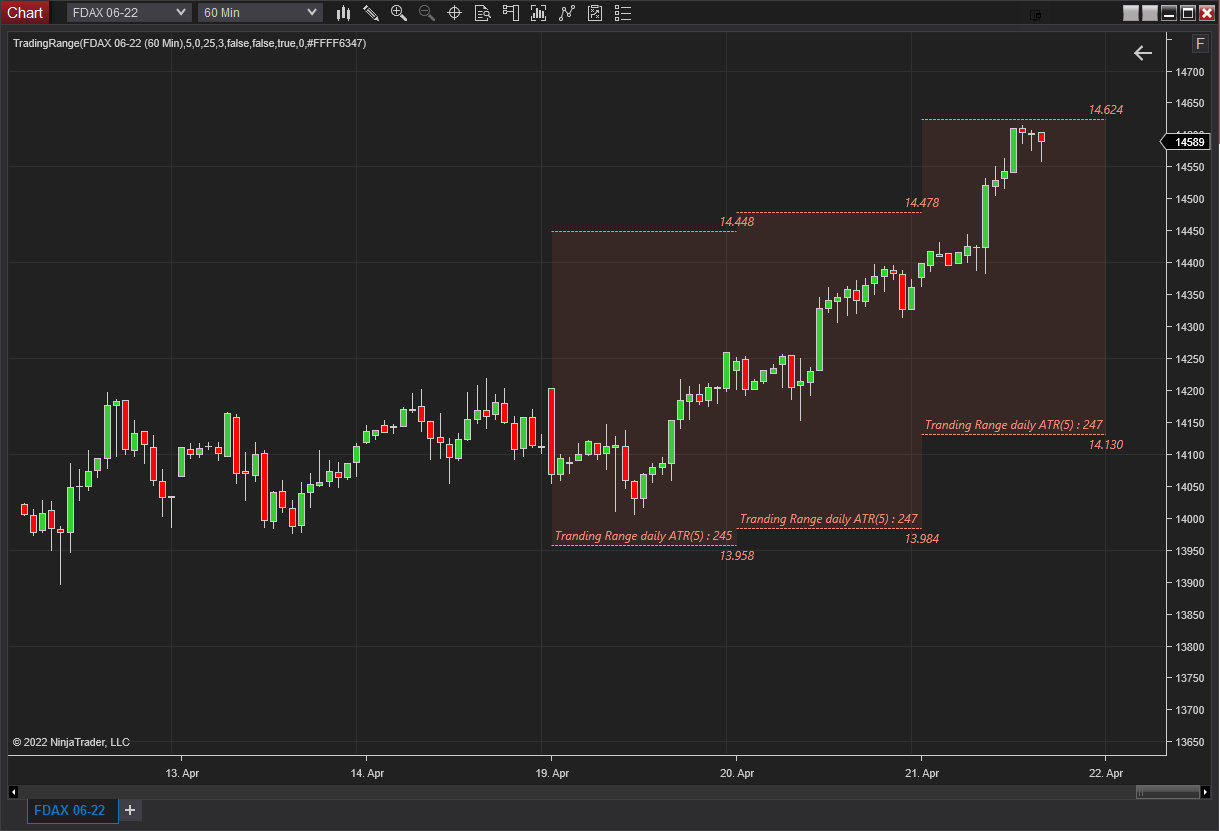
The indicator draws a complete framework of statistically relevant levels:
- ✔ Resistance & Support: Calculated based on your adjustable ATR period.
- ✔ Quartiles (25%/75%): Visualizes Value Area boundaries for institutional-grade trading.
- ✔ Daily Open & Midpoint: The opening anchor point as the day’s most important pivot.
3. Historical Tracking & Session Control
Learn from the past. The TR PRO stores ranges from previous days (user-defined) and „freezes“ them on the chart. This allows you to perform high-quality backtesting and see exactly how price reacted to prior volatility limits.
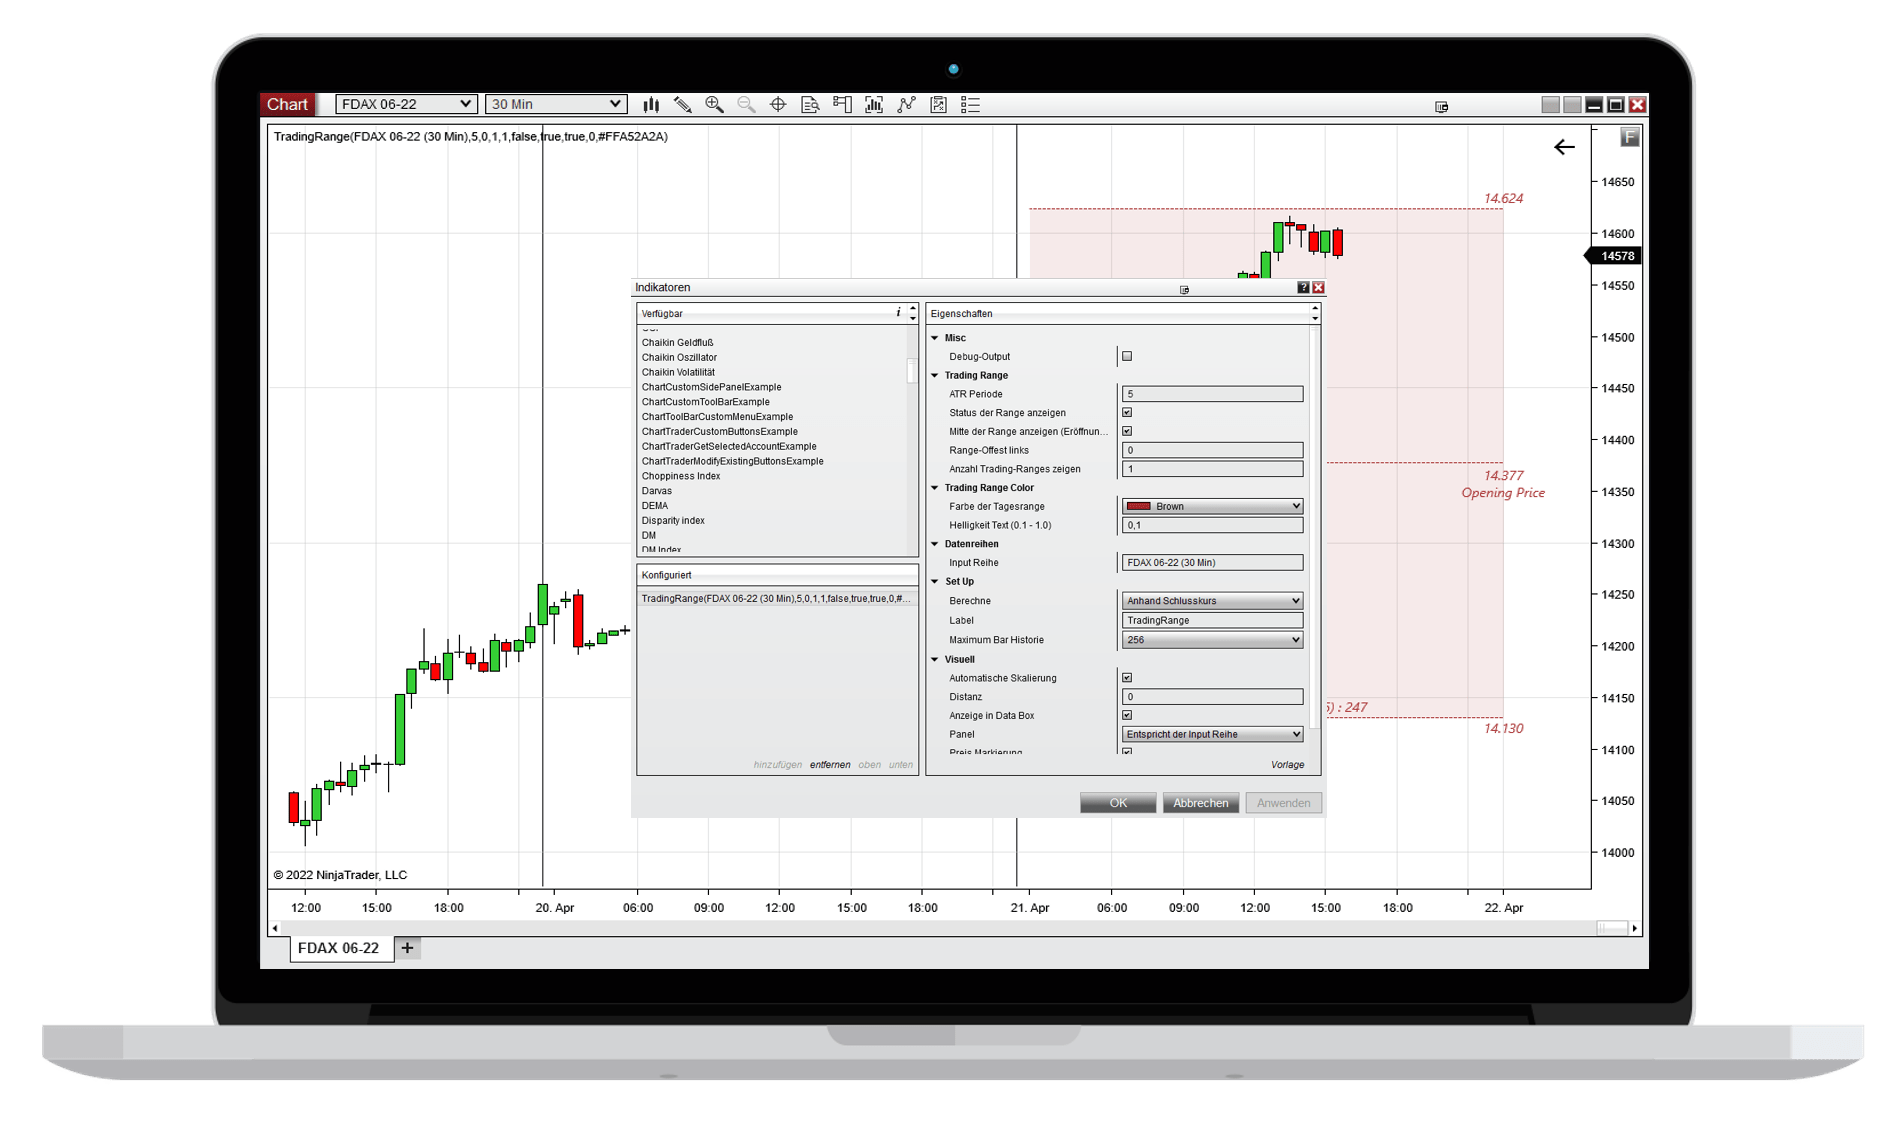
Technical Specs & Pro Features
⚙️ ATR Engine: Variable period for short- or long-term volatility measurement.
⏰ RTH/ETH Support: Use standard session starts or define custom times (perfect for FDAX or ES Open).
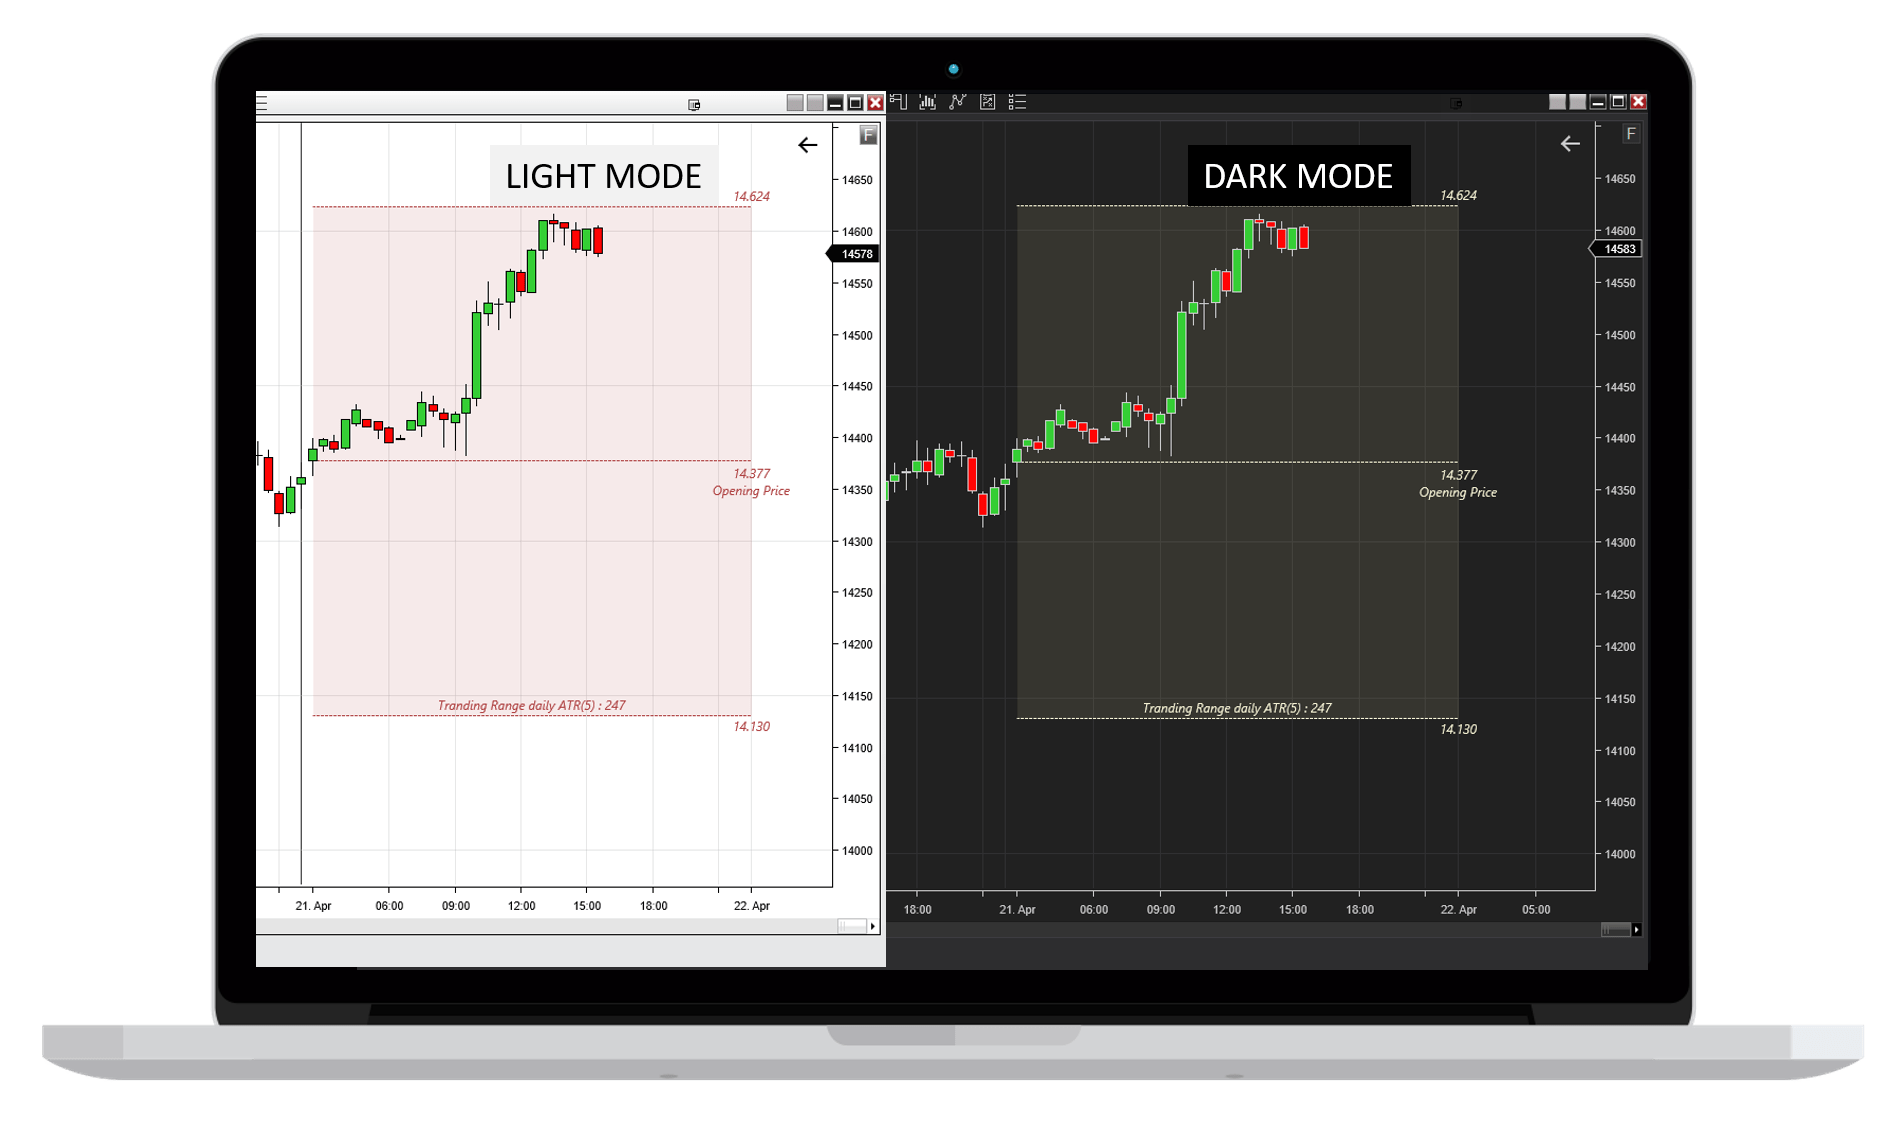
🖌️ Pro Visuals: Individual colors, background opacity, and line thickness for a clean chart aesthetic.
🛡️ License: Lifetime usage. No recurring monthly fees.
Rezensionen
Es gibt noch keine Rezensionen.