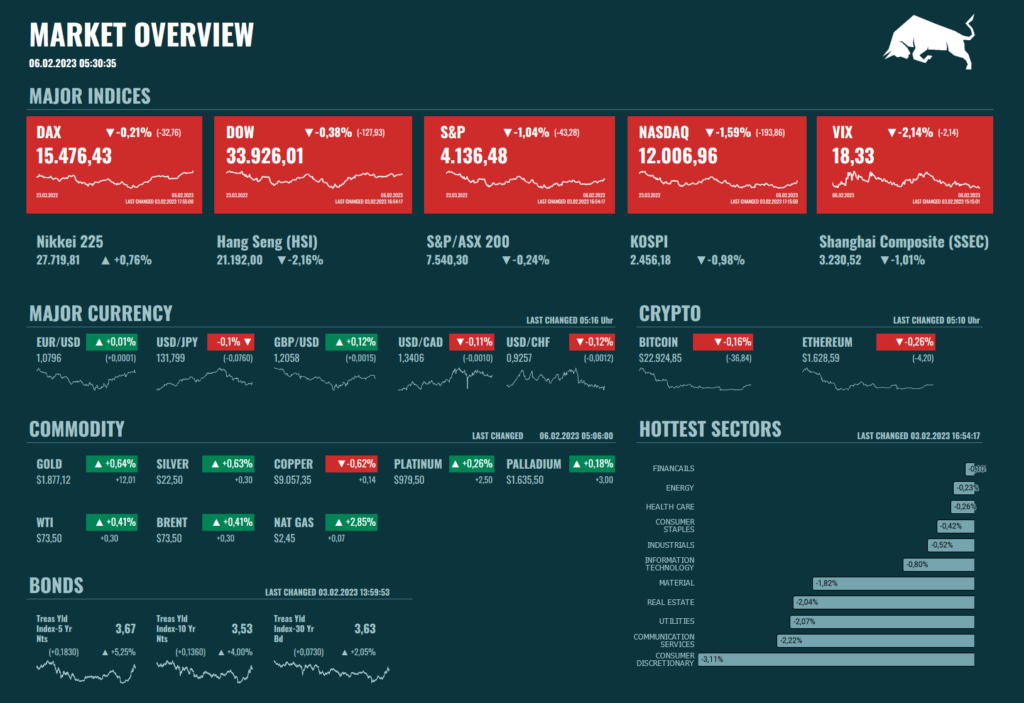
FDAX – Future February, 06 2023
Daily market overview / Marktmeinung
Major important Futures
JETZT Ausführliche marktmeinung als PDF
Important News/public holidays
TERMINE UNTERNEHMEN
- 07:00 DEU: Aurubis, Q1-Zahlen
- 13:30 USA: Cummins, Q4-Zahlen
- 22:00 USA: Activision Blizzard, Q4-Zahlen
- USA: Pinterest, Q4-Zahlen
TERMINE KONJUNKTUR
- 08:00 DEU: Auftragseingang 12/22
- 08:00 DEU: Umsatz im Dienstleistungsbereich 11/22
- 09:00 CHE: KOF Beschäftigungsindikator Q1/23
- 10:30 EUR: Sentix-Investorenvertrauen 12/22
- 10:30 GBR: Einkaufsmanagerindex Baugewerbe 01/23
- 11:00 EUR: Einzelhandelsumsatz 12/22
SONSTIGE TERMINE
- Krieg in der Ukraine
- Feiertage:
…
DATES COMPANY
- 07:00 DEU: Aurubis, Q1 figures
- 13:30 USA: Cummins, Q4 figures
- 22:00 USA: Activision Blizzard, Q4 figures
- USA: Pinterest, Q4 figures
BUSINESS CYCLE DATES
- 08:00 DEU: New orders 12/22
- 08:00 DEU: Services Sales 11/22
- 09:00 CHE: KOF Employment Indicator Q1/23
- 10:30 EUR: Sentix Investor Confidence 12/22
- 10:30 GBR: Purchasing Managers‘ Index Construction 01/23
- 11:00 EUR: Retail Sales 12/22
OTHER DATES
- War in Ukraine
- Holidays:
Trading day (Overview)
| Market Profile OPENING PRICE VERSUS DAY’S VA | in balance |
| Opening to VWAP previous day (M30) | below |
| VA – Market Profile Value Area previous DAY(VAH, POC, VAL) | 15480 … 15456 … 15406 |
| RANGE (ATR 5) | 202 Points |
| Trading-Range daily ATR(5) | 15629 … 15225 |
Action Levels
| Pivot Points R3, R2, R1, PP, S1, S2, S3 in Trading-Rang | 15637, 15553, 15473(PP), 15389, 15309 |
| Previous Day/Today Close / Open | 15470/15427 |
| Open VWAPs in Trading-Range | 15460 |
| Open POCs in Trading-Range | 15456, 15223 |
| Support in Trading-Range | 15392, 15365, 15308/292, 15243/23 |
| Resist in Trading-Range | 15480/92, 15530, 15551, 15582 |
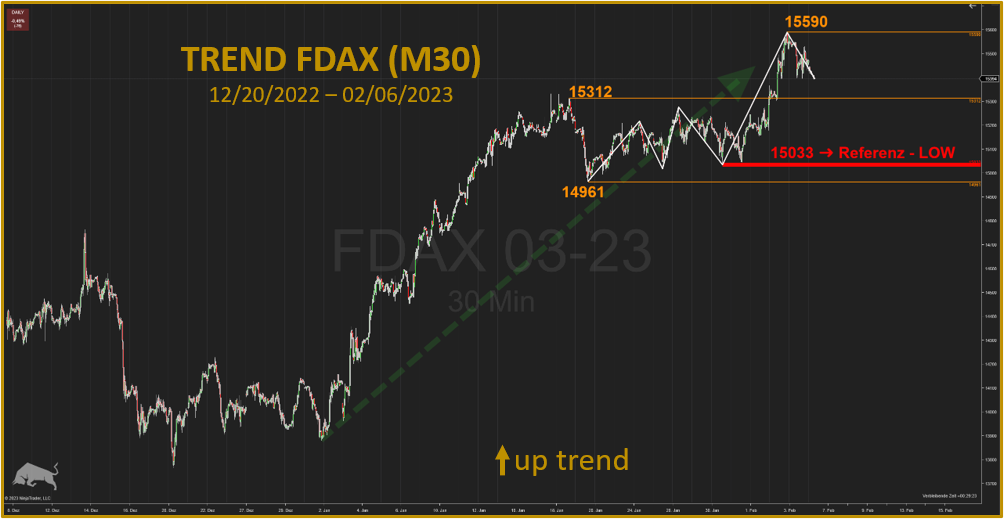
Daily (FDAX)

– Der letzte Handelstag wurde innerhalb des aktiven positiver Außenstabes (15596 … 15302) beendet
– Mehrwellige Aufwärtsbewegung
– Letzter Handelstag neg. IB
– anziehendes Handelsvolumen
– anziehende Volatilität
– Aufwärtstrend noch voll intakt
– Kurse aktuell an den Widerstandszonen vom Januar/Februar 2022 (15639, 15480)
– Support-Zone um 14744 … 14446
– Schlusskurs über GD200, GD50, GD20 im Future und Kassa Markt
– Steigende Anstiege der GD20, GD50 und GD200
– The last trading day ended within the active positive outer bar (15596 … 15302)
– Multi-wave upward movement
– Last trading day neg. IB
– increasing trading volume
– increasing volatility
– Upward trend still fully intact
– Prices currently at resistance zones from January/February 2022 (15639, 15480)
– support zone around 14744 … 14446
– Closing price above GD200, GD50, GD20 in the future and spot market
– Rising ups of GD20, GD50 and GD200
| Short-Ziel | 15140, 14961, 14744, 14595, 14446 |
| Long-Ziel | 15639, 15976 |
M30 (FDAX)
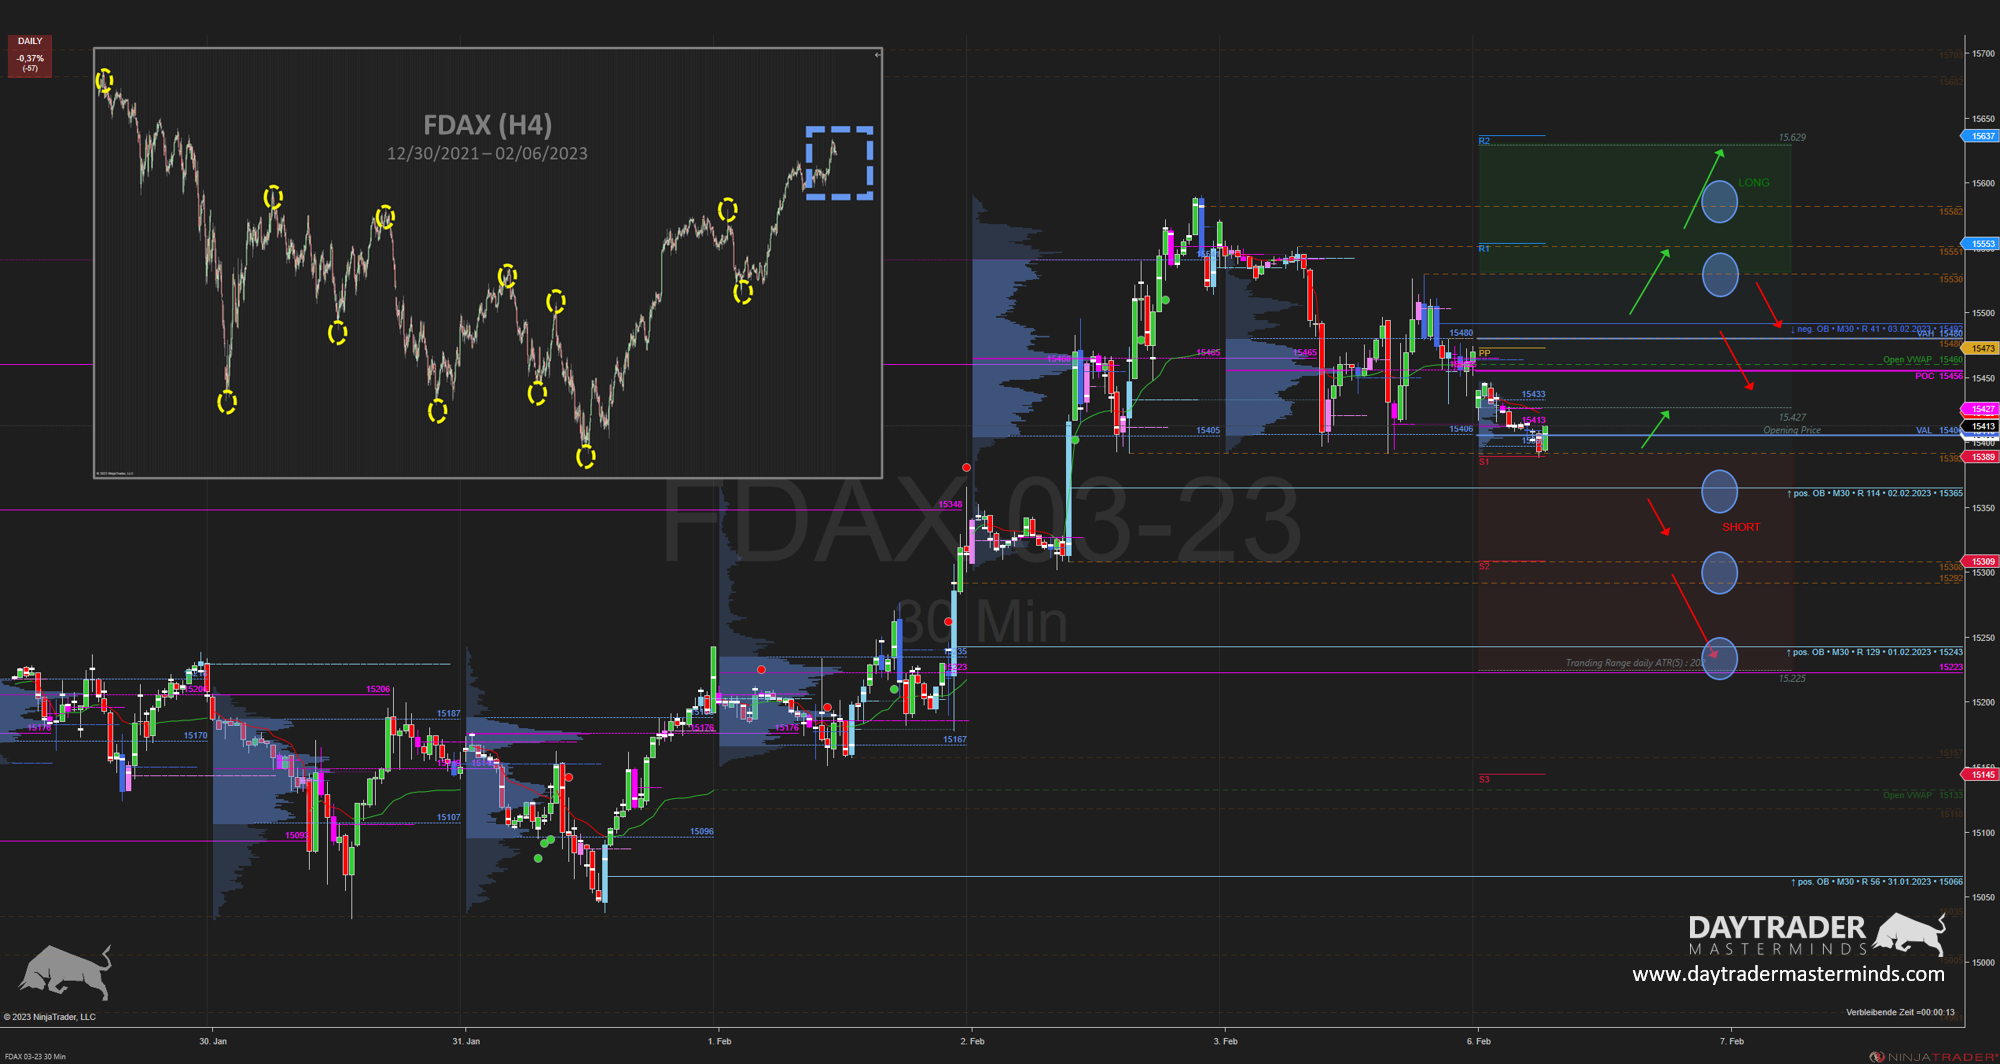
– Konsolidierung auf hohem Niveau
– Aufwärtstrend voll intakt
– Aktuell Korrekturbewegung
– „unechtes“ Down Gap
– Bespielt den pos. OB
– Vorbörse bereits am S1 (Pivot)
– Der heutige Eröffnungskurs lag innerhalb der VA des letzten Handelstages → GLEICHGEWICHT.
– Eröffnungskurs unter dem Pivot Punkt (PP) und unter dem VWAP des letzten Handelstages. In der Vorbörse bereits unterhalb der VAL
– fallende Pivot Punkte und steigende VA’s
– Consolidation at a high level
– Upward trend fully intact
– Current corrective movement
– „fake“ down gap
– Plays the pos. OB
– Pre-market already at S1 (pivot).
– Today’s opening price was within the VA of the last trading day → EQUAL WEIGHT.
– Opening price below the pivot point (PP) and below the VWAP of the last trading day. In the pre-market already below the VAL
– Falling pivot points and rising VA’s.
| Short-Ziel | 15365 (OB), 15308/292, 15223(POC) |
| Long-Ziel | 15582, 15551, 15530 |
FAZIT
Laut Market Profile heute Range. Vorbörslich negativ. Die Ausbruchskerze aus der Range vom 02.02.2023 wird aktuell getestet. Der letzte Handelstag konnte weder die Kerze nach ob sowie nach herausnehmen (IB). Die Tendenz war ebenfalls negativ. Ebenfalls befinden sich die Indikatoren wieder im überkauften Bereich. Die Widerstandszonen im oberen Bereich wurden nun angelaufen bzw. bereits abgearbeitet. Die Luft nach oben wird nun wieder dünner. Der Aufwärtstrend ist jedoch ungebrochen. Rückläufe jedoch ebenfalls wahrscheinlich im daily. Was persönlich auffällt die die Greed Indikation von 76, für mich immer auch ein Kontraindikator.
In der kurzfristiger Zeitebene (M30) ist der Aufwärtsimpuls immer noch voll intakt. Mit dem letzten Handelstag wurde eine Korrektur eingeleitet. Die 15582 ist ein starker Widerstand. Aktuell hält die 15392 als untere Unterstützungszone. Wird diese per M30 Schlusskurs nach unter gebrochen könnte eine weitere Bewegung bis 15308/243 einsetzen. Diese jedoch auch nur als Korrektur.
Zum Wochenstart stehen wieder Quartalsberichte von US Großkonzernen an, wie Pinterest und Activion Blizzard. Ansonsten sind keine großen Ereignisse oder bekannte Termine die marktbewegend sein könnten.
Bullish/Bearish Scenarios
Bullish Scenario
Der Aufwärtstrend ist vorerst noch ungebrochen. Rückläufe sind somit kaufenswert (intraday). Wünschenswert, da auch vom CRV dann besonders attraktiv, sind Kurs bei 15365, 15308 für Long-Einstiege. Sollten wir keinen Rücklauf bekommen und die M30 Schlusskurse sich wieder oberhalb von 15406 bewegen, suche ich Long-Einstiege bis 15480, 15530.
Bearish Scenario
Shorts suche ich ausschließlich als Rücklauf mit einem engen Stopp. Bleibt der M30 Schlusskurs auch zur Kassa-Eröffnung unterhalb von 15406, suche ich Short-Signale mit Zielen bis zu meinen gewünschten Long-Einstiegspunkten.
CONCLUSION
According to Market Profile Range today. Pre-market negative. The breakout candle from the range of 02.02.2023 is currently being tested. The last trading day could neither take out the candle to the top as well as to (IB). The trend was also negative. Likewise, the indicators are again in the overbought area. The resistance zones in the upper area were now approached or already worked off. The air to the top is now getting thinner again. However, the upward trend is unbroken. Reversals, however, also likely in the daily. What personally stands out the Greed indication of 76, for me always a contra indicator.
In the short-term time frame (M30), the upward impulse is still fully intact. With the last trading day, a correction was initiated. The 15582 is a strong resistance. Currently, the 15392 holds as a lower support zone. If this is broken per M30 closing price to the bottom, a further movement to 15308/243 could begin. This, however, only as a correction.
At the start of the week, quarterly reports of major U.S. companies are again pending, such as Pinterest and Activion Blizzard. Otherwise, no major events or known dates that could be market-moving.
Bullish/Bearish Scenarios
Bullish Scenario
The uptrend is still unbroken for now. Returns are therefore worth buying (intraday). Desirable, since also from the CRV then particularly attractive, are course at 15365, 15308 for long entries. If we do not get a retracement and the M30 closing prices move back above 15406, I look for long entries to 15480, 15530.
Bearish scenario
Shorts I am looking for exclusively as a retracement with a tight stop. If the M30 close remains below 15406 even at the cash opening, I look for short signals with targets up to my desired long entry points.
Happy Trading 🙂
Matthias

Additional Information